


The building energy management system (BEMS) industry plays a vital role in helping organizations monitor and reduce energy consumption across facilities. SAVEe is a web-based BEMS platform that enables efficient oversight of building groups, individual floor and room data, renewable energy, equipment control, environmental metrics, and energy billing, all in one system.
Among these many functions, this project focused on one of the most essential: energy target management.
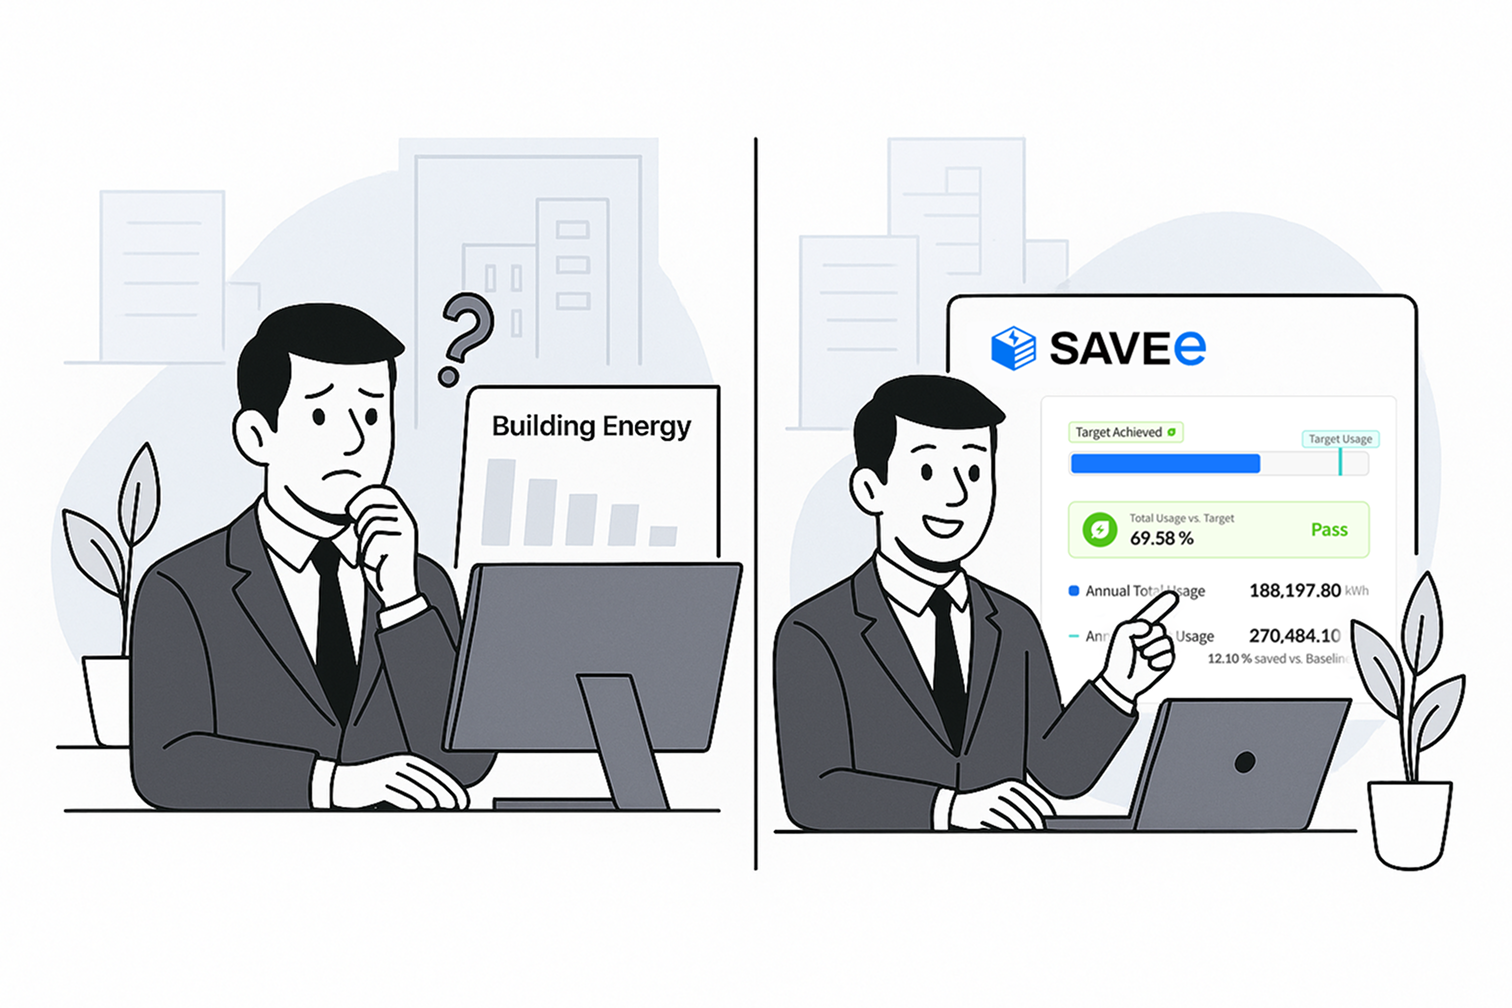
To support energy professionals in planning and monitoring reduction efforts, we designed a simple and intuitive energy target feature for SAVEe. This MVP emphasized usability, clarity, and practical relevance to ensure it could be easily adopted and scaled by facility teams.
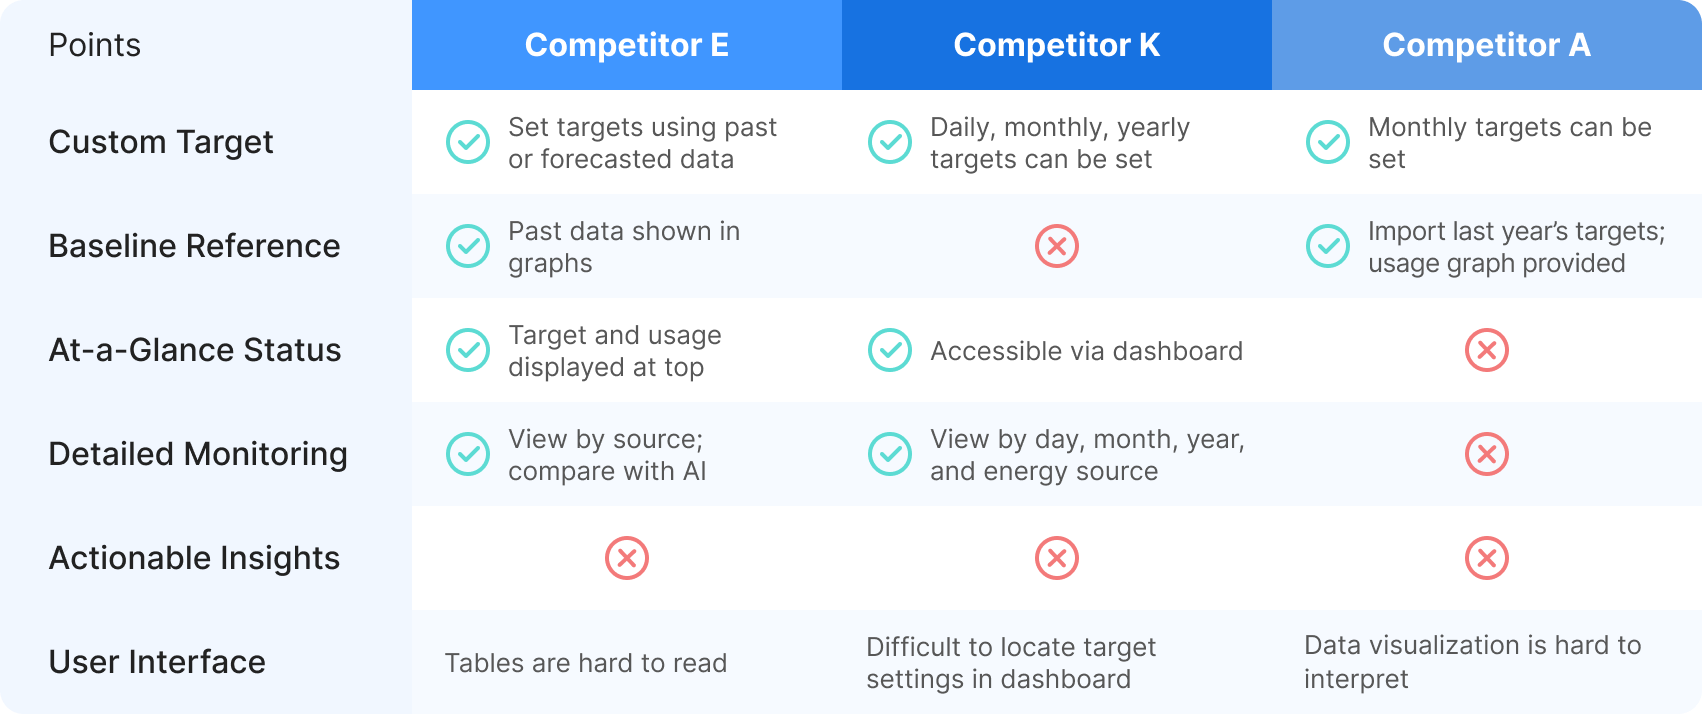
To design an MVP aligned with our project goals, we conducted a competitive analysis of existing BEMS solutions. This helped us identify both strengths and gaps in the current market. Through this process, we found that most platforms lacked automated baseline calculations, offered rigid goal-setting interfaces, and failed to clearly visualize progress. These insights revealed a clear opportunity for SAVEe to differentiate itself by building a user-centered, intuitive energy target management feature.

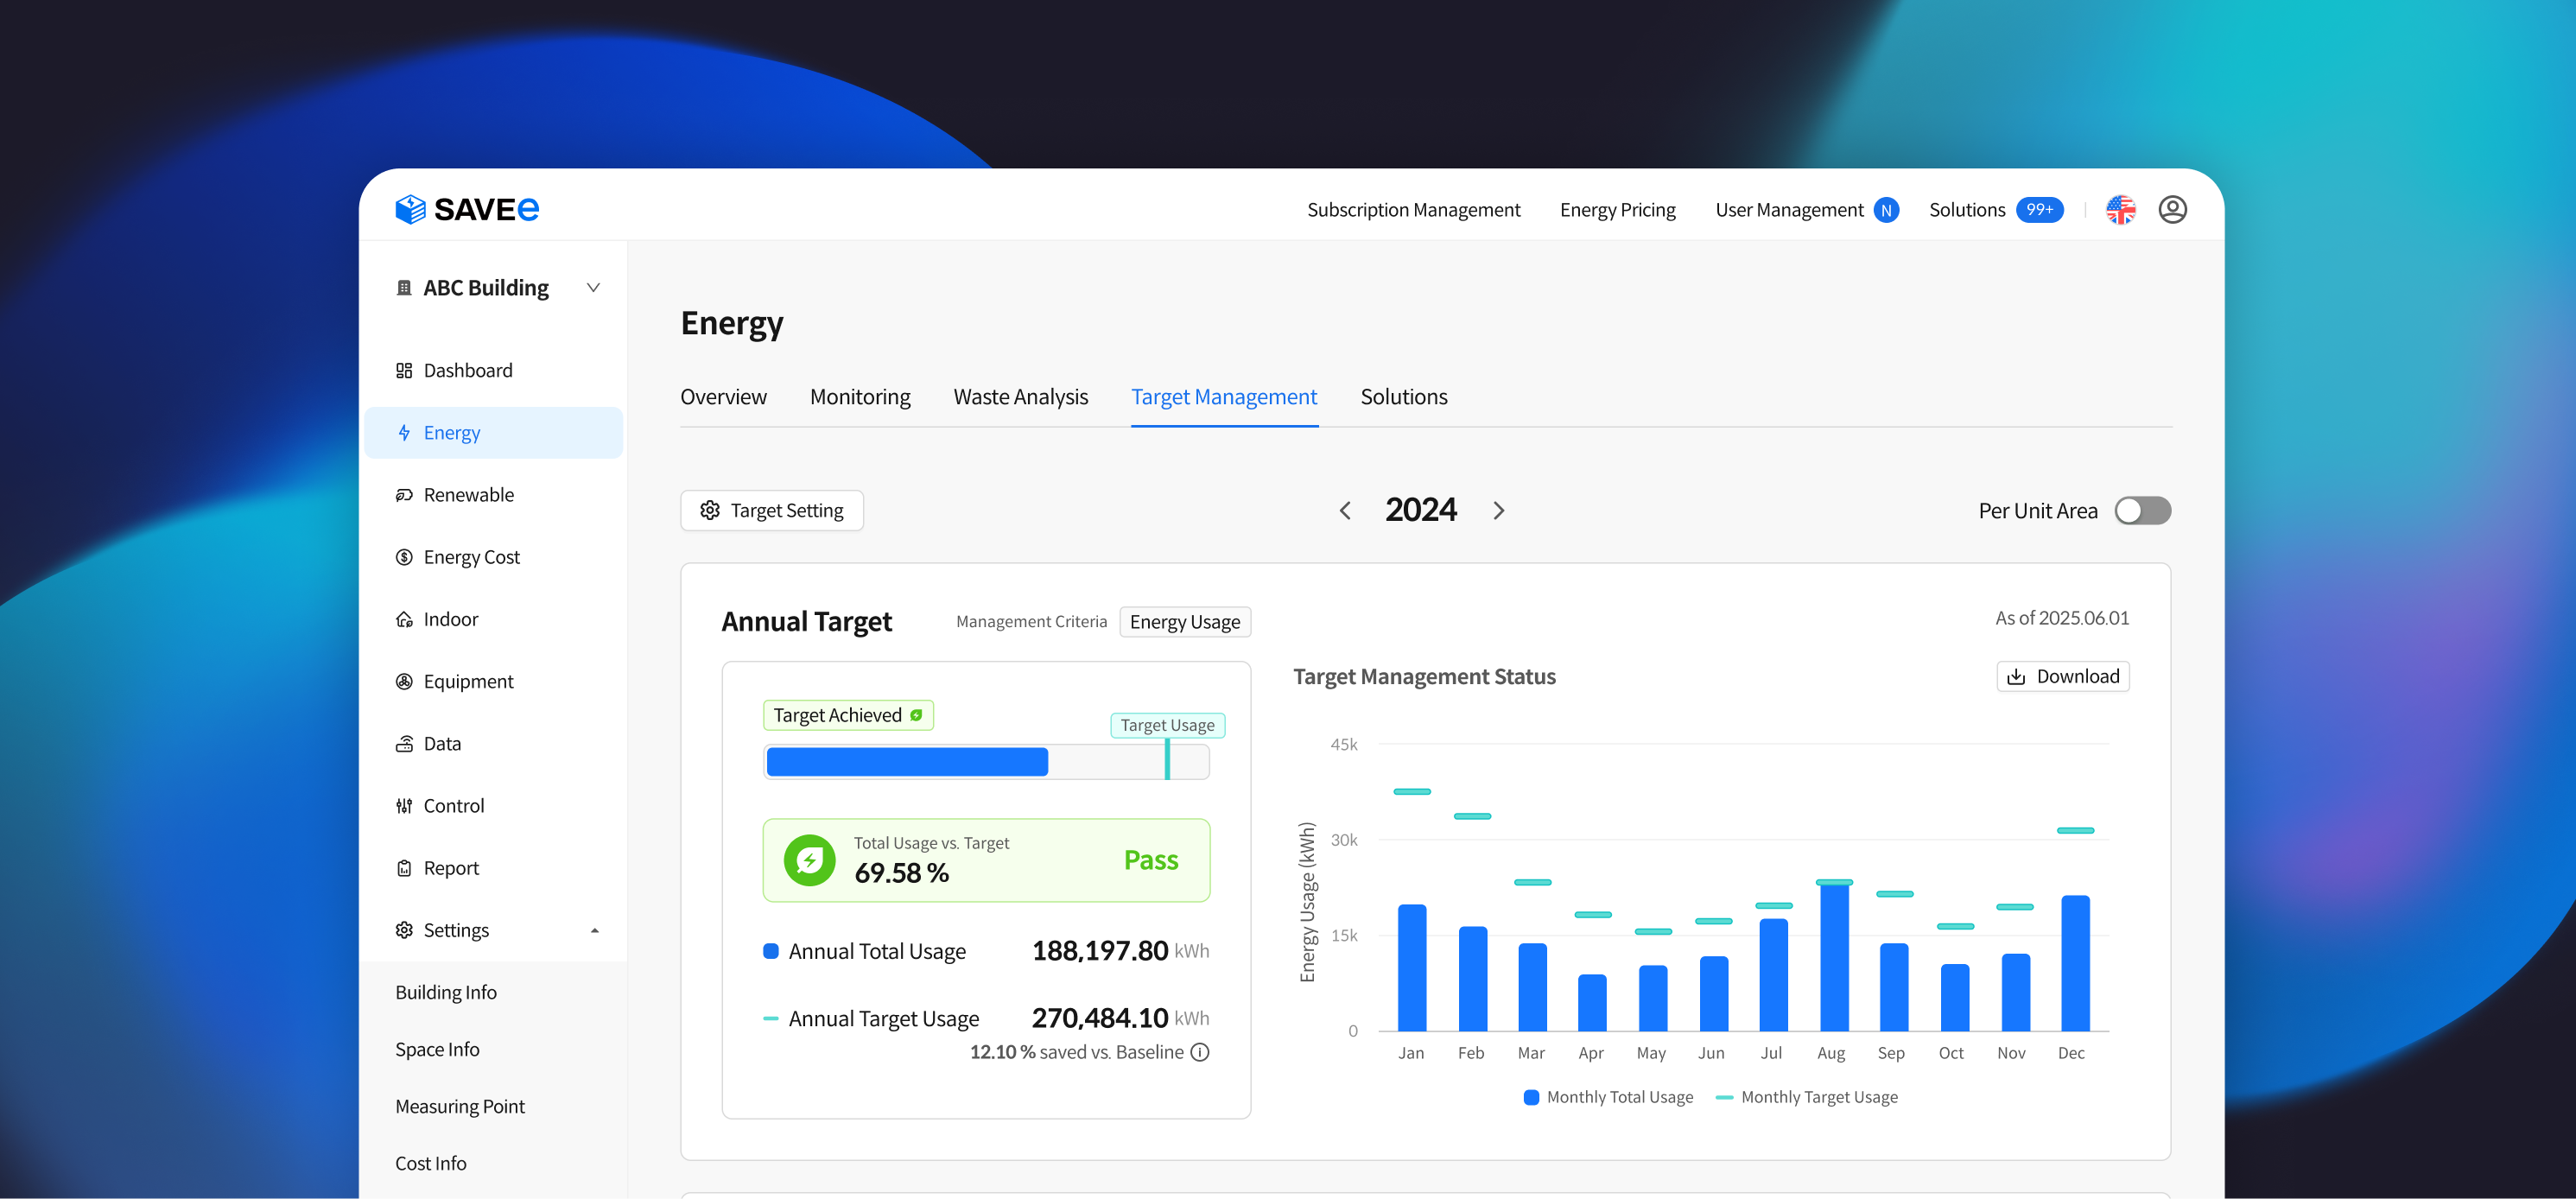
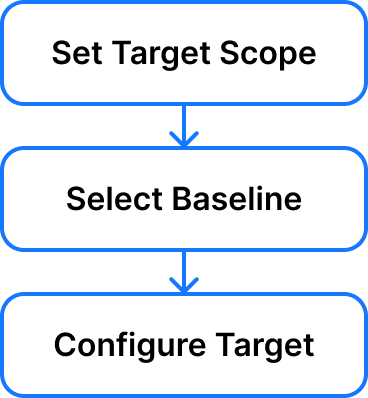
To improve visibility, the entry button for target setting was placed at the top of the dashboard. The setting page was designed with a clear three-step layout: define the target scope, select a baseline, and set a goal.
Users can set targets based on historical usage data from the building. For first-time users, SAVEe provides default or regional reference values to make initial setup easier and more informed.
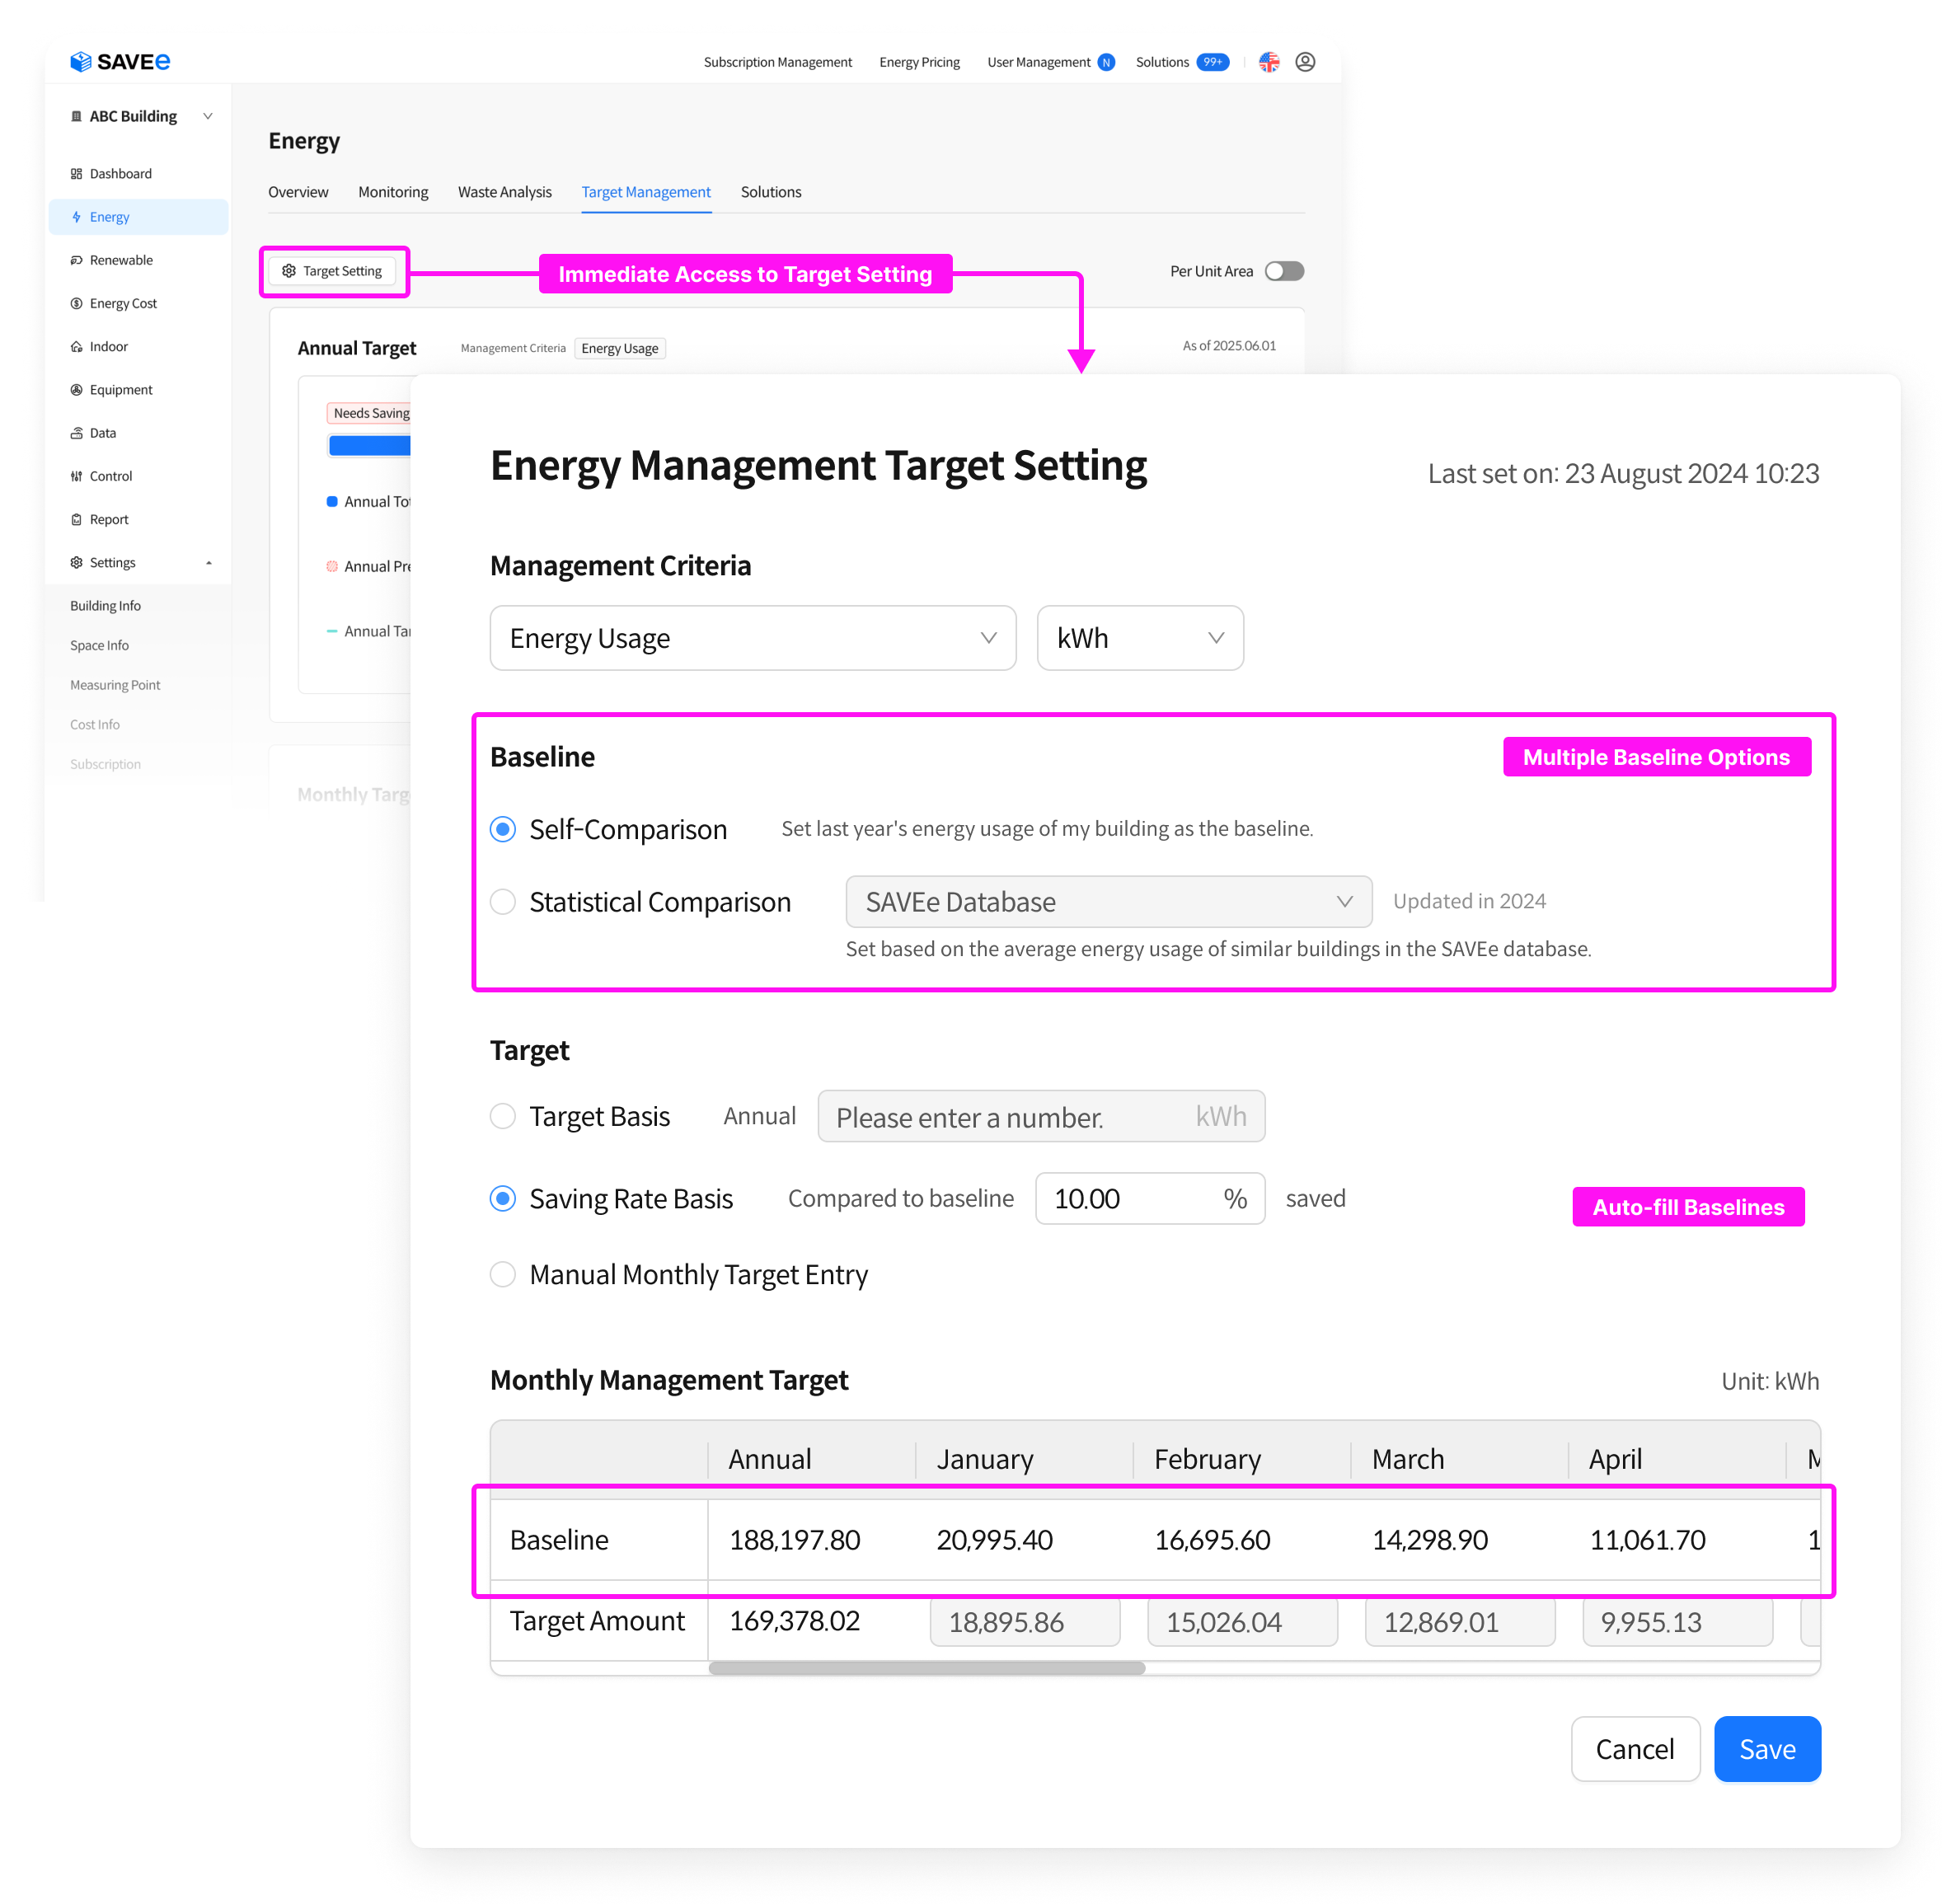
Users can set annual targets, define monthly goals based on reduction from a baseline, or manually input each month's target. Since energy usage varies by season, it was important to let users compare their targets against a reference baseline. To support this, SAVEe automatically distributes the monthly target across the table and visualizes how it compares to the reference data.

The dashboard was designed to highlight performance at a glance. When users enter the page, they immediately see the current year and month’s progress, with clear indicators of how close they are to reaching their goals. Predictive values are also shown to help users anticipate and respond in advance.
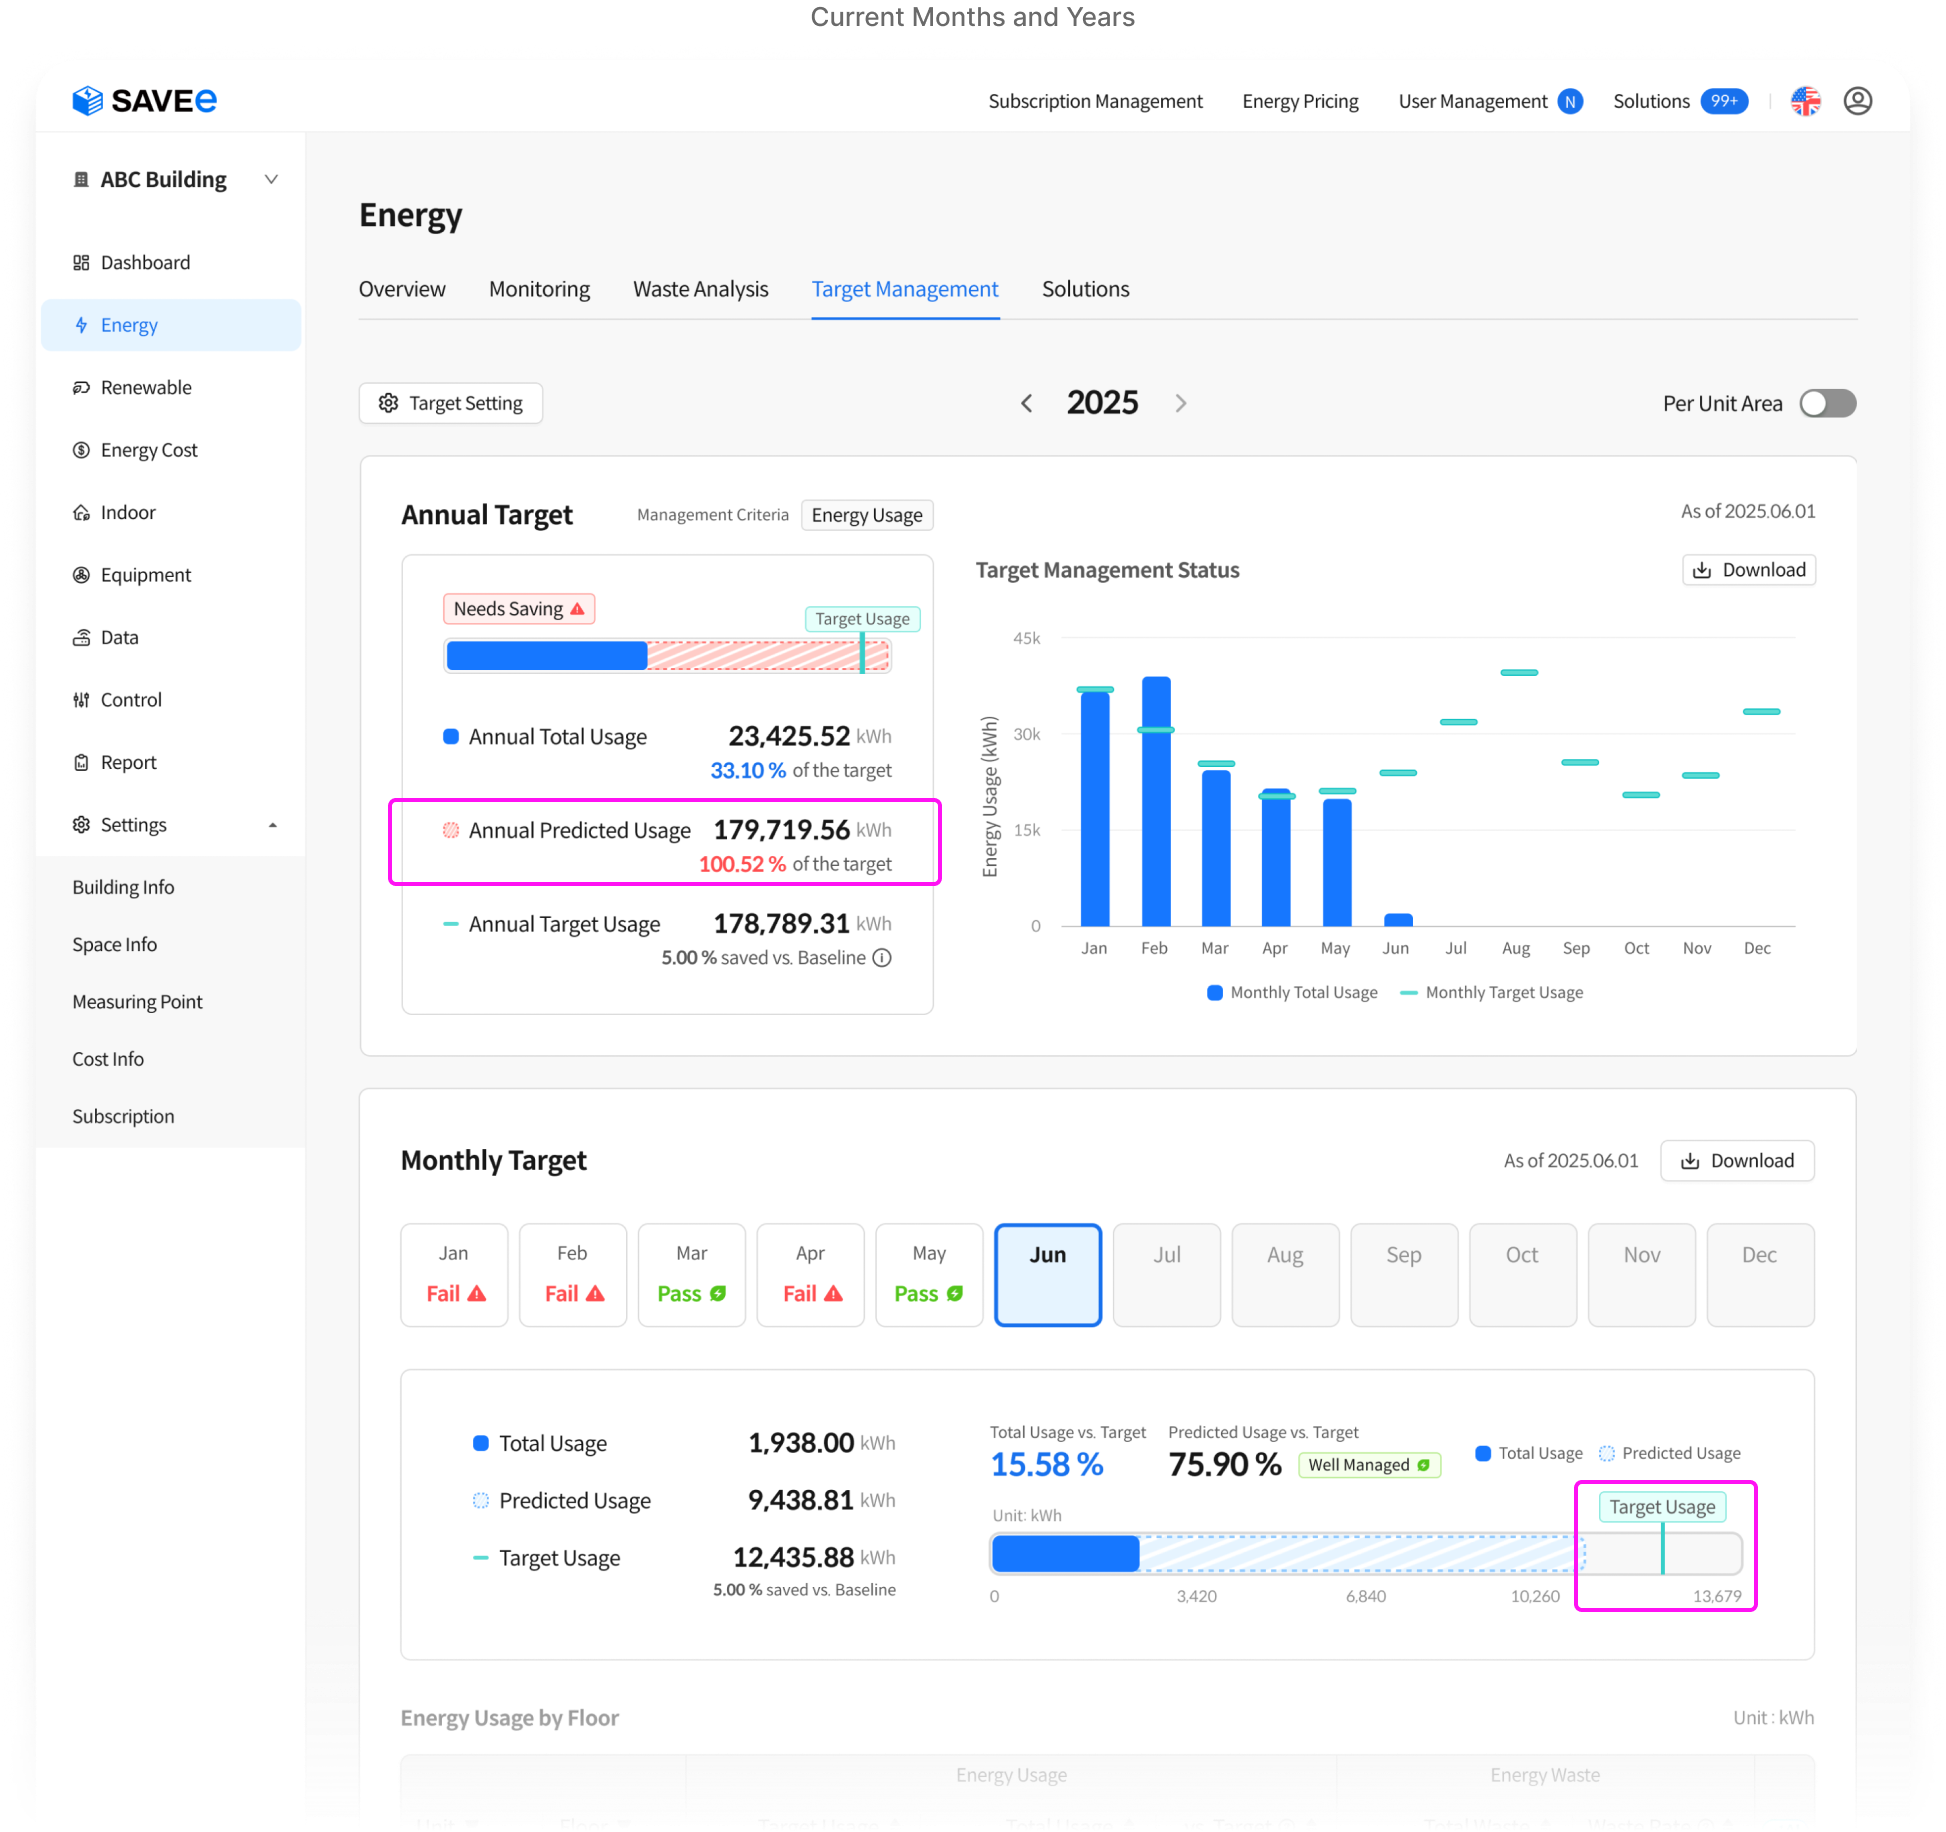
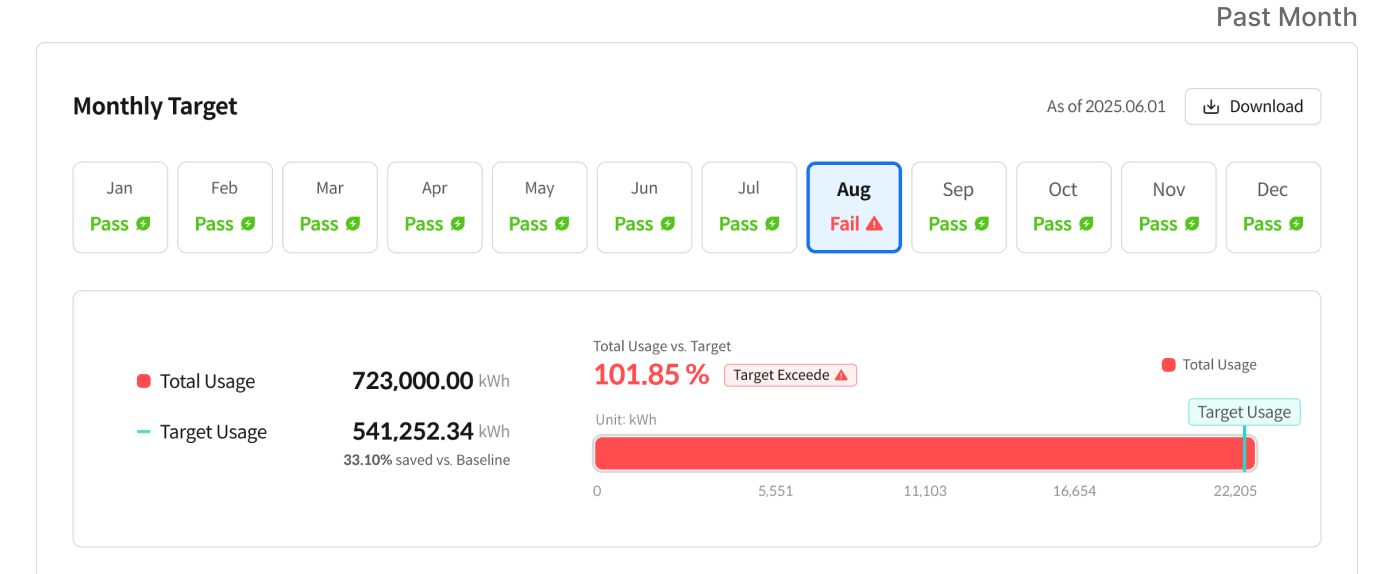
Past months and years are displayed using strong, distinct colors and percentage indicators to make historical performance easy to interpret at a glance.

For annual performance, monthly progress is visualized in a bar chart format so users can quickly grasp usage trends across the year.
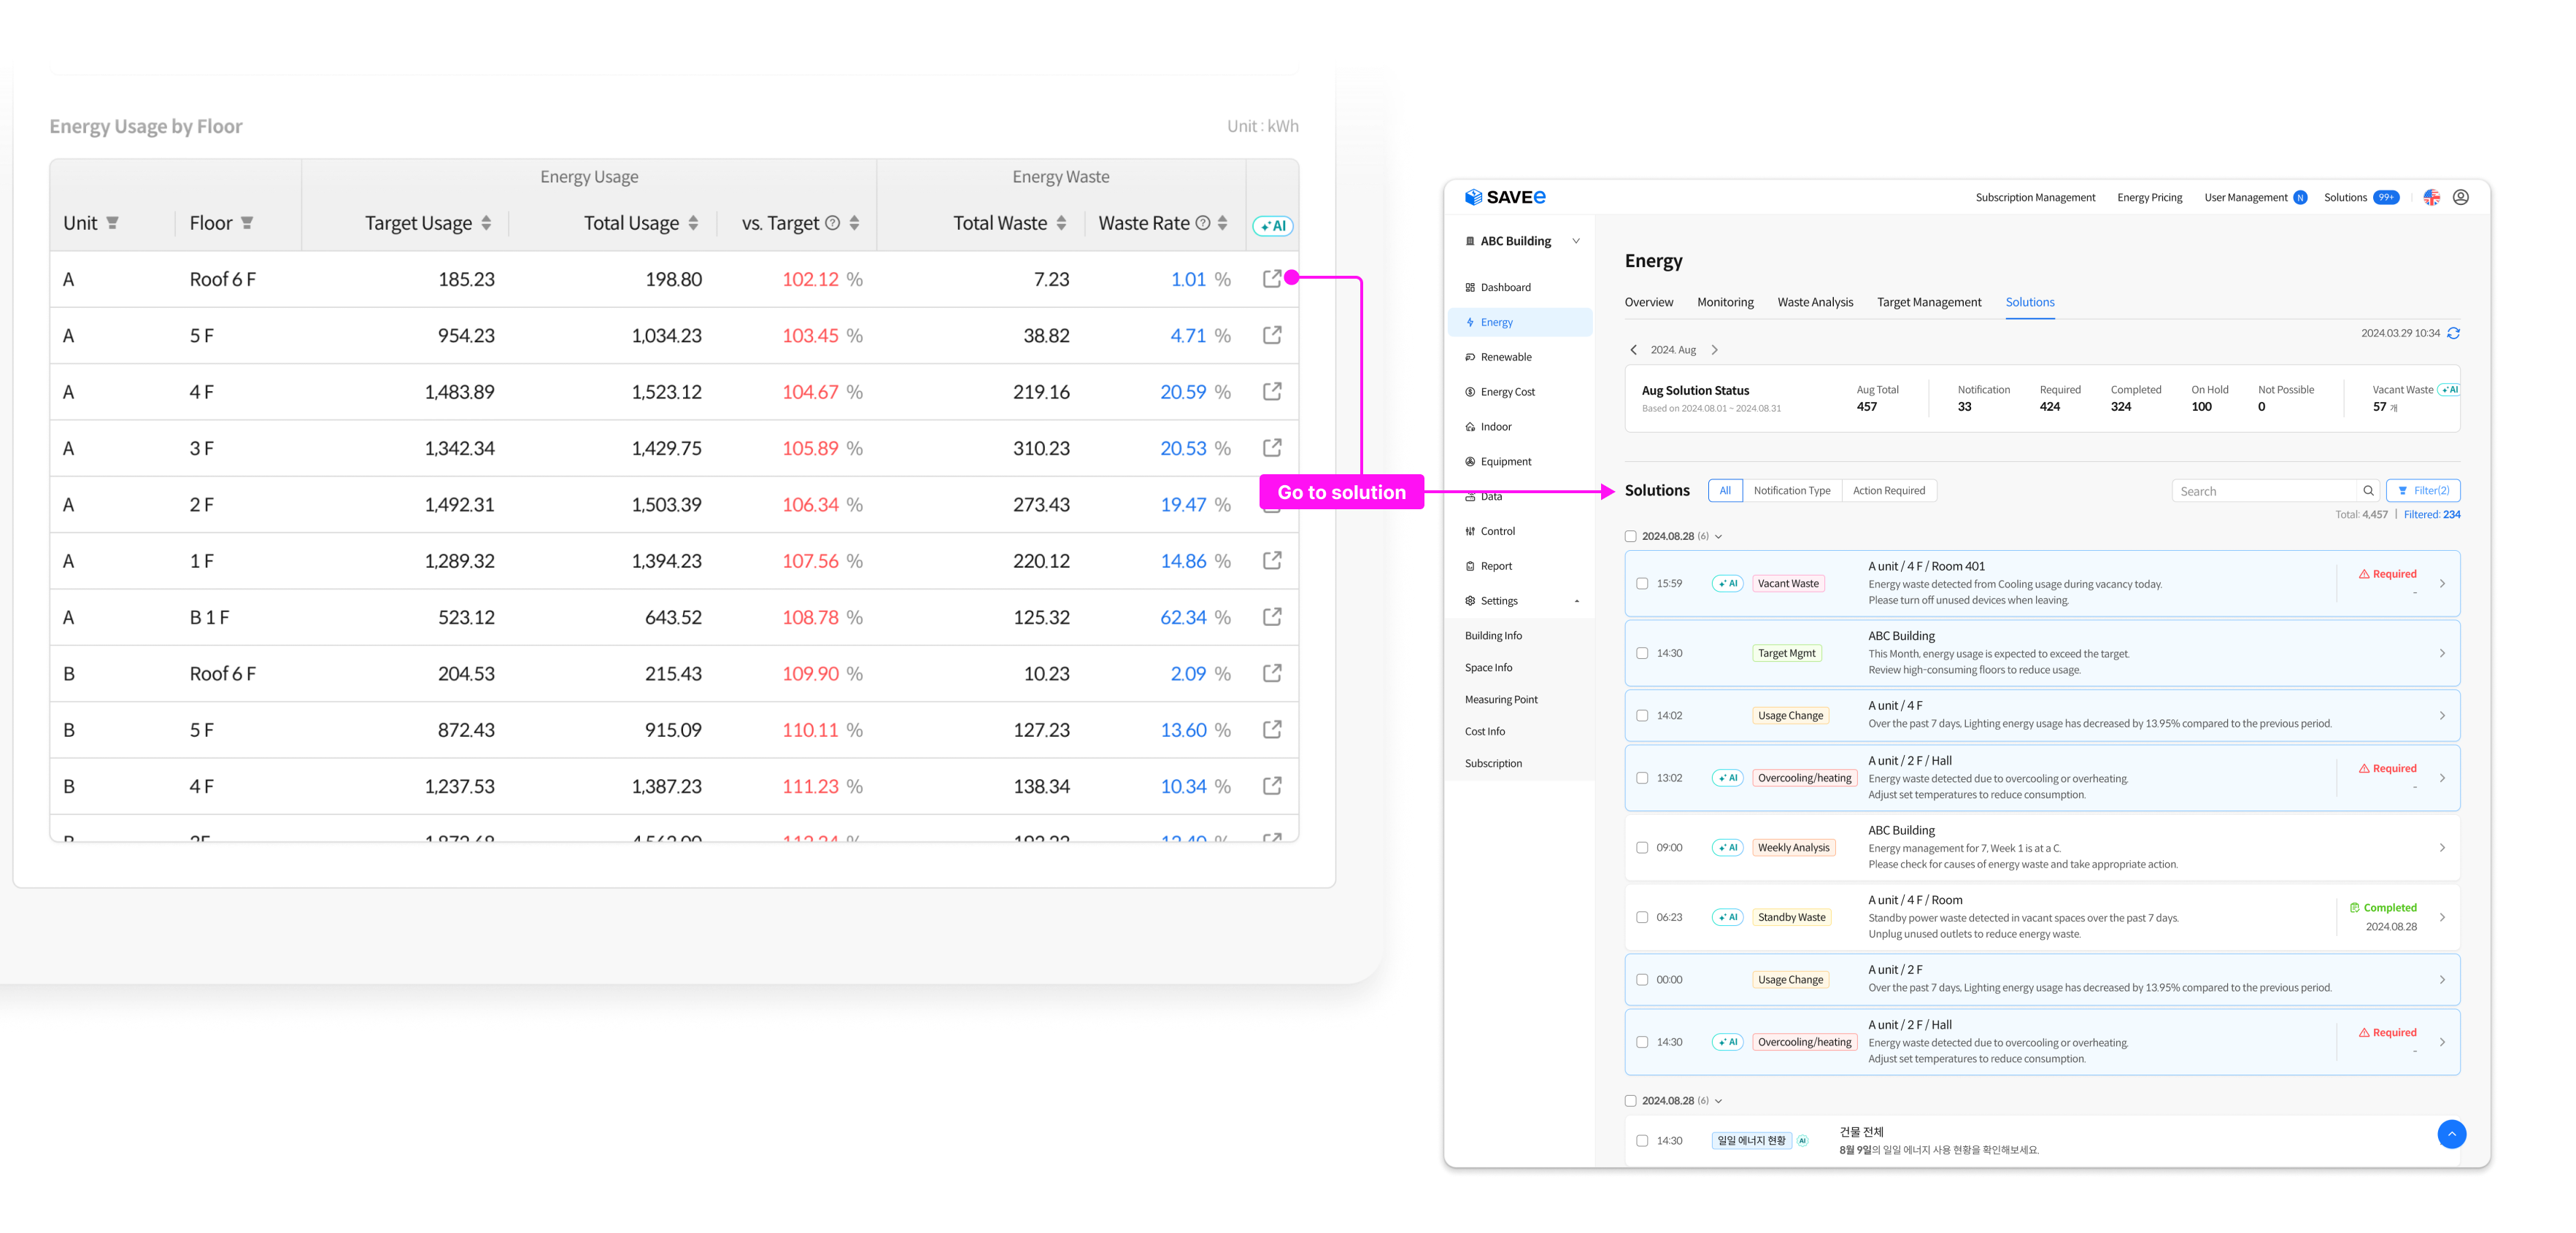
Unlike other platforms, SAVEe enables users to view energy usage and performance by floor, making it easier to identify areas of overconsumption.
When a floor exceeds its monthly target, users can access a dedicated solution page to explore recommended actions.
This design encourages users not only to monitor usage but also to take follow-up steps—turning insights into concrete energy-saving plans.
The MVP was developed collaboratively with front-end and back-end developers and presented to potential clients. We received positive early feedback, including:

This project reinforced the importance of simplifying complex systems through intuitive visual design. I focused on translating market gaps into practical design features that support actual workflows. Although we initially lacked direct user research data due to tight schedules, later feedback confirmed the design was on the right track. Additionally, the positive reactions opened up opportunities to expand the system with features like energy-saving simulations and control-based suggestions in future updates.


